

“Why is my app slow again?
“Who was it that deleted that record last Tuesday at 3 AM?”
“The server just crashed… and I don’t know why.”
If you’ve ever whispered any of these at midnight in front of a glowing terminal, you know: logs are your best friend—and your worst nightmare. You need a tool that does not just consume logs but makes sense of them without burning a hole in your budget or your sanity.
But with names like Splunk, ELK Stack, Datadog, Grafana Loki, New Relic, and Papertrail floating around, how do you choose? Been there. Tried free tiers, accidentally racked up $500 in bills, and built dashboards that looked impressive but told me nothing.
After years of trial and error (and a few “Oops, I broke production” moments), I’ve narrowed it down to 7 factors that really matter. Let’s go through them together.
1. Deployment Model: SaaS vs. Self‑hosted – The Classic Dilemma
The first decision you face is whether to run the tool yourself or let someone else do the work.
- SaaS (Datadog, New Relic, Papertrail, Splunk Cloud) You sign up, paste in an API key, and the logs start flowing. No servers to patch, no disk space to manage, no “Why is Elasticsearch down again?” headaches. It’s ideal for startups, small teams, or anyone who loves to sleep.
- Self-hosted (ELK Stack – Elasticsearch, Logstash, Kibana) Also Grafana Loki + Promtail) It’s all yours: the infrastructure, the retention policies, and security. This setup works well for compliance (healthcare, finance) or when you have large volumes of logs, especially if the SaaS price tag makes you hesitate. But be ready to moonlight as an Elasticsearch admin.
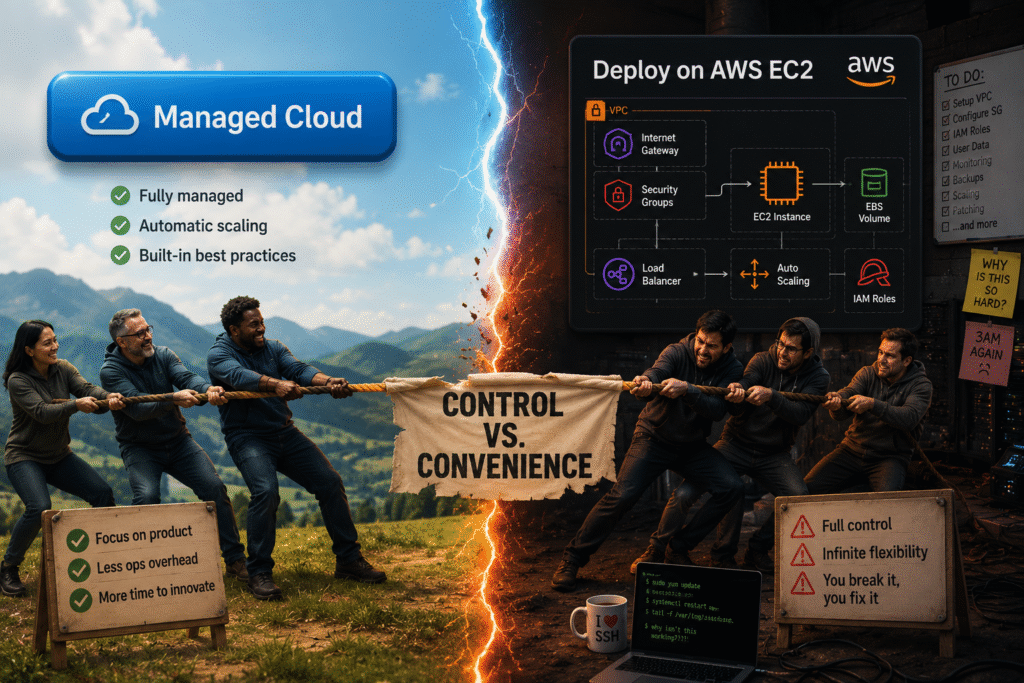
Real talk: I’ve spent an entire weekend tuning. Elasticsearch heap sizes after my self-hosted ELK crashed. Not again. I’m happy to pay a little more for SaaS these days, unless my company data policy requires me to self-host. Decide based on your team’s time versus money equation.
Which tool wins?
- Easiest SaaS: Papertrail (setup in 2 minutes)
- Most powerful self‑hosted: ELK Stack (unlimited customization)
- Hybrid option: Grafana Loki (can be self‑hosted easily or used in Grafana Cloud)
2. Query Speed: Because Nobody Has Time for “Loading…”
You’re on a production incident call. The manager is watching you closely. You search for an error from the last 15 minutes… and you wait. 5 seconds. 10 seconds. Spinny wheel of death.
Query speed is a key factor in your on-call experience.
- Splunk – Splunk is known for its speed, thanks to its indexed data model. You pay for the speed, however.
- Datadog & New Relic – Very fast for recent logs (past 1-2 days). If you don’t upgrade, you can archive older logs to slower storage.
- ELK Stack – Fast if you tune the mappings and sharding. But a poorly configured ELK out of the box is slow as molasses.
- Grafana Loki – Different philosophy: no index of full log content, just labels. Splunk is faster than searching for a specific phrase within a log, for example (“payment failed”). But scanning labels is immediate.
- Papertrail – Great for real-time tailing and searching the last 48 hours. Beyond that—oof, expect a wait.
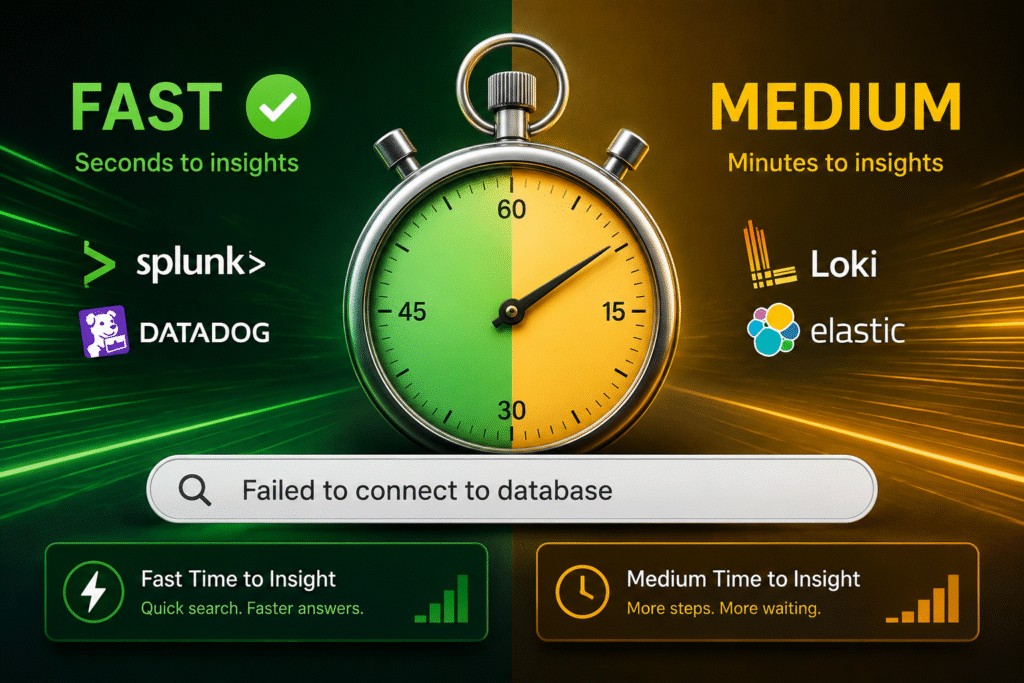
Human advice: Test with your actual log volume. Grab a free trial, pump 10 GB of your logs in, and run a few common searches, like errors across the last 7 days. If it feels sluggish today, it’ll be worse when you have 10x more logs.
3. Visualization & Dashboarding – Turning Noise into Insight
Logs are raw diamonds. Dashboards are the shine that makes them polish. A good monitoring tool should allow you to see trends without having to write a single line of code (or at most, minimal SQL).
What to look for:
- Pre‑built dashboards: For common services (Nginx, PostgreSQL, Kubernetes, AWS Lambda).
- Drag‑and‑drop editor: Kibana (ELK) has “Lens”; Datadog has “Dashboard UI”; Grafana is the king here.
- Ability to mix logs + metrics + traces: That’s the holy grail of observability.
My take:
- Grafana – Unbeatable. Beautiful, open-source, hundreds of community dashboards. If you want pixel‑perfect graphs, go with Grafana (and you can pair it with Loki, Prometheus, or even a separate Elasticsearch).
- Kibana – Powerful, but it feels a bit clunky. Great for log analytics, not as sleek for infrastructure metrics.
- Datadog / New Relic – Polished, but locked into their ecosystem. You can’t easily export a Datadog dashboard to another tool.
- Splunk – The dashboards are functional and powerful, but they have an “enterprise software” look—not bad, just not Instagram‑worthy.
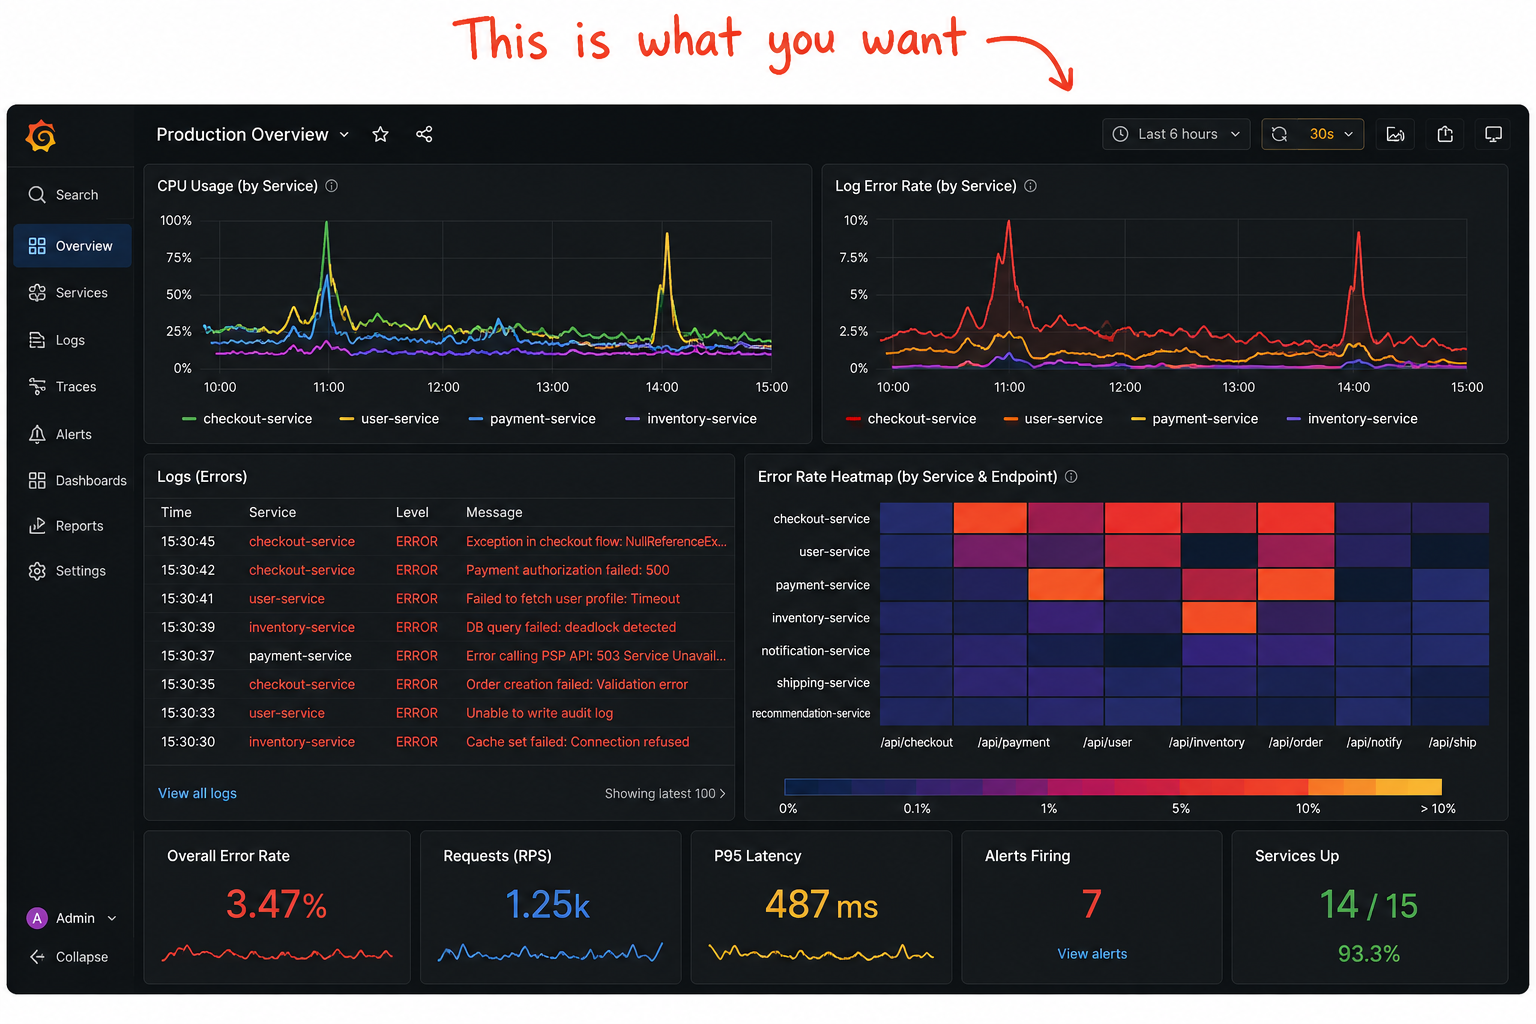
Storytime: Once I spent 3 hours making a beautiful Grafana dashboard with a world map of API request origins. My manager saw it, said “cool,” and never opened it again. But I felt like a wizard. So yes, dashboards matter for your morale too.
4. Alerting Capabilities – Wake Me Up When Something Breaks
A log tool that doesn’t alert is just a fancy grep. You need to know before your users do.
Key questions:
- Can I alert on a log phrase (“OutOfMemoryError”)?
- Can I set thresholds (e.g., “5 errors per minute for 2 minutes”)?
- Does it support silencing / maintenance windows? (Nobody wants a 3 AM alert for a scheduled deploy.)
- Integrations with PagerDuty, Slack, Opsgenie, or just email/SMS?
Tool comparison:
- Datadog – Best alerting. You can include logs, metrics, and traces in one monitor. If the log shows ‘DB timeout’ and the CPU is above 80% page the on-call engineer. Beautiful.
- Splunk – Highly flexible (saved searches, scheduled reports, real-time alarms). “Can be too much for small teams”
- ELK Stack – Uses Watcher (Paid feature of X-Pack) Open-source ELK does not have alerting, so you’ll need to use ElastAlert or a third party tool.
- Grafana Loki – Alerting uses Grafana’s alerting engine (which is good). Not as feature-rich as Datadog but improving every month.
- New Relic – Good alerting but it’s kind of tied to their “NRQL” query language and has a small learning curve.
- Papertrail – Basic “Save a search and get email alerts,” but no paging or debouncing. No paging, no debouncing. Okay for hobby projects.
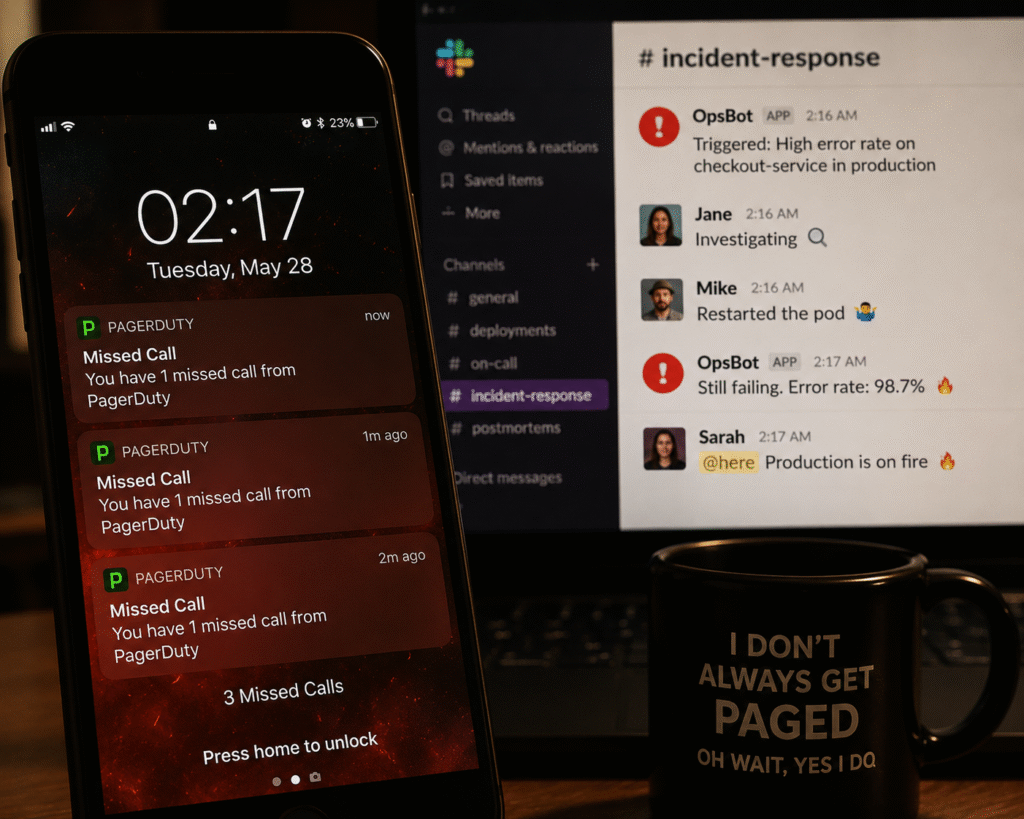
Pro tip: Try out the “flapping” of your alert. Log 20 times per minute. Is the tool spamming you or grouping intelligently? I once got 600 emails in one hour from Papertrail. Never again without throttle and slack integration.
5. Log Retention Policies – How Long Can You Keep the Receipts?
You need logs for different reasons:
- Debugging recent issues – 7 to 30 days
- Compliance (PCI, HIPAA, SOX) – 1 to 7 years
- Trend analysis – “Did this error appear 6 months ago?”
Common policies:
- Papertrail – 2 days free plan, up to 14 days (or unlimited with add-ons). Excellent for real-time tailing, useless for historical forensics.
- Splunk You set retention per index, e.g. 90 days then delete. Very flexible but difficult to control.
- ELK Stack – Index Lifecycle Management (ILM) puts everything under your control. Want to keep 10 years? Purchase additional disk capacity.
- Datadog / New Relic – Typically 15 days by default for logs but can extend to 30 days on higher tiers. Holding for longer costs more – a lot more.
- Grafana Loki – Stores log data in object storage (S3, GCS, MinIO) That means you can store logs forever for pennies – but querying old logs will be slower.
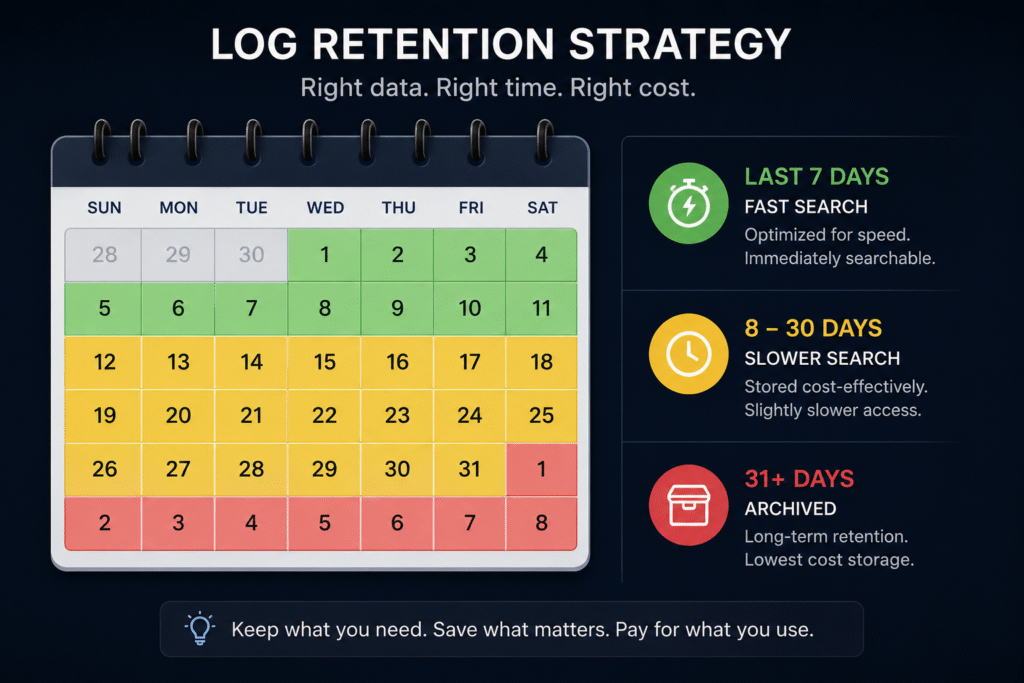
The “budget trick”:
Many teams use a tiered approach:
- Hot storage (fast, expensive)—lasts 7 days → Datadog or Splunk
- Cold storage (cheap, slow)—everything older → dump logs compressed to S3 and use AWS Athena or Loki’s cold tier.
I’ve seen startups save 80% on log bills this way.
6. Cost Per Ingested GB – The Silent Budget Killer
Let’s be honest: log tools are priced like luxury cars. And the meter is always running.
Industry benchmarks:
| Tool | Ingest cost (per GB) | Additional gotchas |
| Splunk Cloud | 1.50–1.50–3.00 | Ingest is everything; retention extra. |
| Datadog | 1.00–1.00–2.00 (log management add‑on) | Also bills for “indexed logs” vs “archived logs”. |
| New Relic | Free up to 0.5 GB/day; then ~$0.50/GB | Generous free tier for small teams. |
| Papertrail | $7/month for 2 GB total (not per day) | Cheap for low volume, expensive per GB if you exceed. |
| ELK Stack (self‑hosted) | Cost of EC2 or physical servers | Hardware + your time. Can be very cheap if you have spare capacity. |
| Grafana Loki (self‑hosted) | Negligible – mostly S3 storage costs (~$0.023/GB/month) | Query time is your time. |
True story: A colleague of mine accidentally shipped debug logs (10GB/day) to Datadog. Two weeks later he got a $1,200 bill. Ouch. He now uses log sampling (send 1 out of 100 debug logs) and preprocessing to remove noisy fields.
Pro advice:
- Never log secrets or entire HTTP request bodies or large stacktraces when they aren’t needed.
- Log levels are your friends – send ERROR logs to your expensive tool (Splunk/Datadog) and DEBUG logs to Loki or a local file.
- Many tools charge for ingest, meaning you pay even if you never query those logs. So be harsh.

7. Integration with Cloud Providers (AWS, Azure, GCP)
You probably don’t run on bare metal any more. Your logs are scattered across Lambda functions, S3 buckets, Azure Blob Storage, GKE clusters, and perhaps an old Heroku app.
What To Watch For:
- Native integrations – Does the tool offer a one-click integration with CloudWatch, Azure Monitor, or Cloud Logging?
- Agent support – Can a single agent (e.g. Datadog agent, Fluentd, Promtail) be deployed to harvest logs from EC2, ECS, Lambda, and S3?
- Cross-cloud – If you are multi-cloud, can you centralize AWS + GCP logs in one place?
Quick per‑tool summary:
- Splunk – Great AWS & Azure Add-ons (Splunk Observability Cloud) Heavy but it works.
- Datadog – Best-in-class AWS integration. Auto-discovers Lambda, RDS, ECS. Also works well for GCP and Azure.
- ELK Stack – Uses Beats (Filebeat for logs) and Elastic Agent. Totally flexible, but needs to be configured.
- Grafana Loki – Promtail can scrape logs from anywhere (e.g., S3 via Lambda). Very cloud-native.
- New Relic—AWS integration is good; GCP & Azure seem like 2nd-class citizens
- Papertrail – Basic You can send logs via syslog from any cloud VM, but there is no auto-discovery.
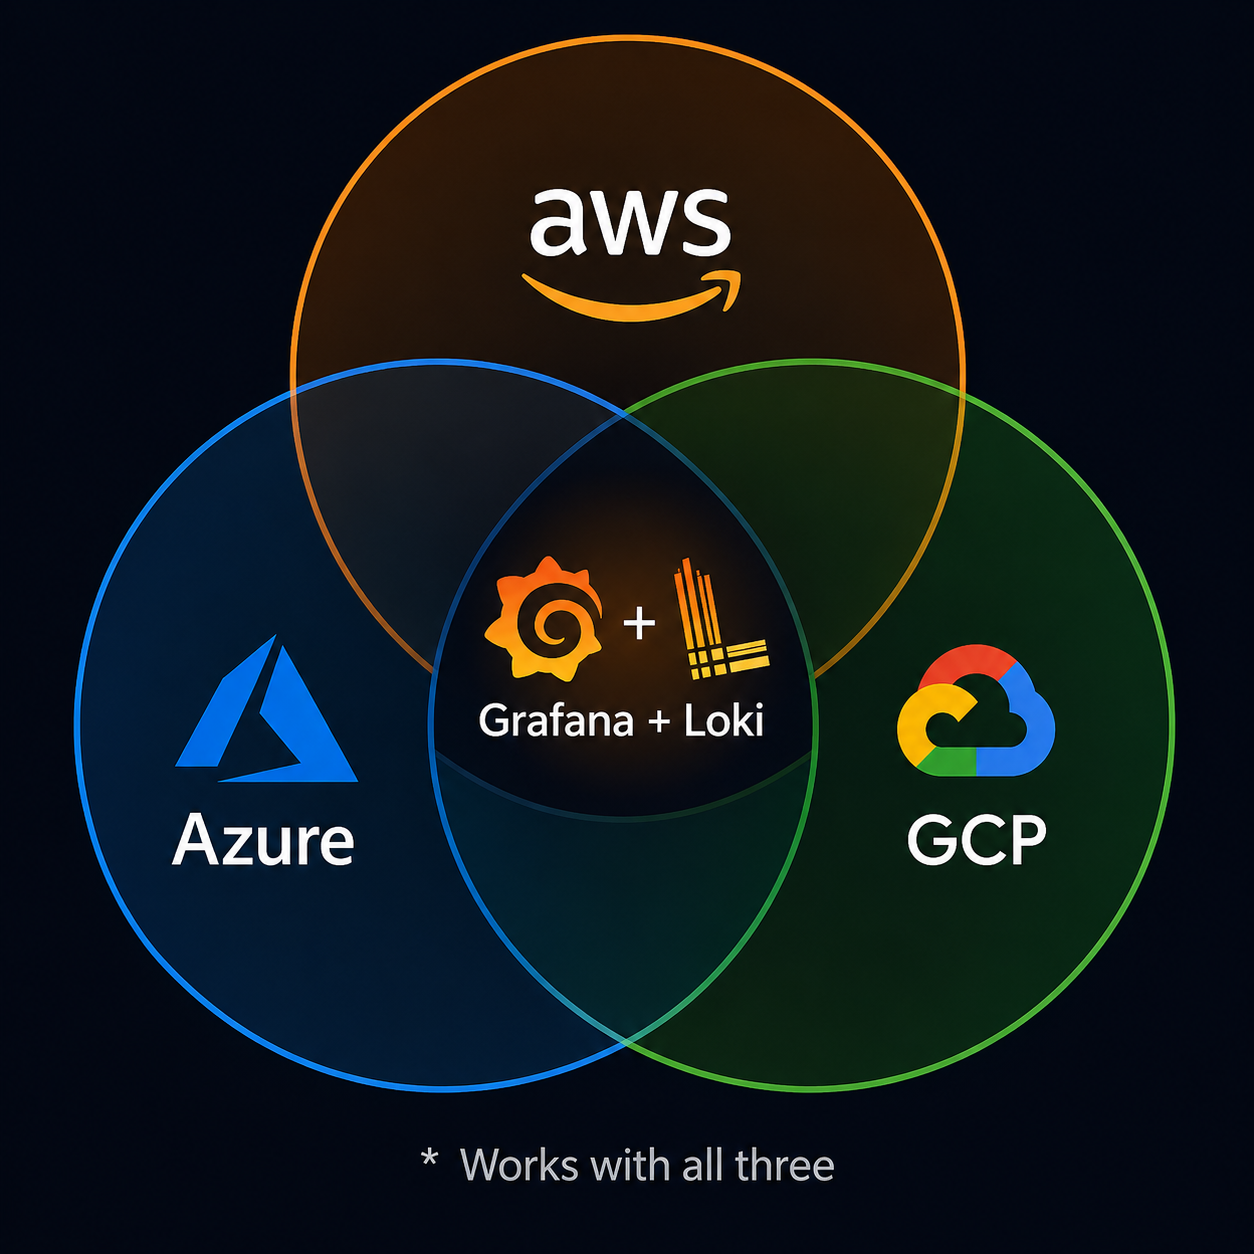
My setup: Grafana Loki + Promtail on Kubernetes (GCP) + Lambda function that sends CloudWatch logs to Loki. It’s not turnkey, but it’s cheap and I can query everything from one grafana instance. If I had a bigger budget and less time I’d choose Datadog.
So… Which Tool Should You Actually Pick?
I can’t give you a one‑size‑fits‑all answer – but I can give you a decision flow that works:
- ELK Stack (self-hosted) or Loki if you have a $0 budget and good Linux skills.
- If your team is small (<5 people) and <50 GB of logs/day go with Papertrail or New Relic’s free tier.
- If you are in a heavily regulated industry (finance, healthcare) -> Splunk (self-hosted or cloud).
- If you want the “Apple” experience—expensive but just works → Datadog.
- If you love open source & already use Grafana for metrics, use Loki + Grafana.
And remember: you don’t have to marry the tool. Start with a free trial of 2–3 options. Send real logs for a week. See which one doesn’t make you want to throw your laptop out the window.
Final Thoughts (And a Friendly Warning)
Logs are the black box of your application. You seldom need them—until you desperately need them. The worst time to pick a logging tool is during an outage. Get your homework done today.
And one final nugget of human wisdom: Whatever tool you pick, schedule a monthly “log budget review” with your team. Kindly refer to the top 10 sources of log volume. Ask: “Do we really need all these info logs from that internal service? You’d be amazed at how much you can cut back on—and how much money you’ll save.
Happy logging and may your dashboards always be green
Have you used any of these tools? Got a horror story about a surprise log bill? Share it in the comments – misery loves company.
